Local leaders have the power to inspire action across communities. Critically though, leadership requires being a model for the actions you are trying to inspire. To lead on sustainability across the community, you need to practice sustainability in your own operations.
So where do you start? Some good first steps include:
When local governments and school districts adopt these practices, they reduce the resource use in public facilities, saving money and reducing emissions. Those activities give local leaders increased credibility to engage citizens and businesses in sustainability efforts. Because you have addressed your own activities first, you can say "we did it and you can too."
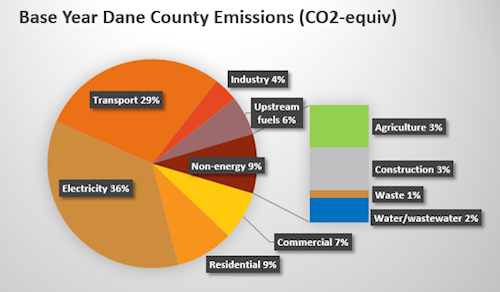
As part of developing Dane County's Climate Action Plan, we created a 2017 baseline of 
carbon and carbon equivalent emissions produced in Dane County. Overall in 2017, Dane County produced about 7.5 million metric tons of carbon equivalent emissions. More than half of emissions were associated with the built environment, such as electricity for buildings as well as natural gas and other fuels that heated those buildings (shown as Residential and Commercial in the chart). More than half of the remaining emissions come from transportation. Industry, agriculture, waste and other activities make up less than a quarter of emissions produced in the County.
The County's baseline identifies the total emissions produced in Dane County. Another way to look at emissions is by consumption. Consumption-based emissions are those associated with all activity that takes place in a specific region. Production and consumption emissions vary because items are often made in a different location than they are used, and both contribute to emissions. For example, when you buy a car the emissions associated with making the car (production emissions) occur where the car was produced.
Looking at consumption-based emissions is helpful to understand the total carbon footprint of an entity or region because it takes into account your activities as well as all the goods and services you purchase. The Cool Climate Network offers a consumption-based emissions map that shows how emissions vary by zip code. The mix of emissions, such as the amount for electricity versus travel, will vary by location. Check out the map to see the typical mix of household emissions in your zip code and then use our Household Carbon Calculator to see how your household compares to the typical. Other entities, including Climate TRACE, are working on additional maps and data associated with greenhouse gas emissions.
Setting public goals is critical to achieving results. Share your emission commitments with others who can hold you accountable because when communities set climate and clean energy goals, achieving those results becomes more likely.
Beginning in 2008, more than 140 local governments in Wisconsin passed Energy Independent Community resolutions. Today about 1 in 3 people in Wisconsin live in a community with ambitious climate action goals. Local government generally set one goals relative to their own operations, to their whole community, or both. Within each category, goals might focus on reducing energy use, transitioning to renewable electricity, transitioning to renewable energy (electricity + other forms of energy like transportation fuels), reducing greenhouse gas emissions or some combination of those objectives. Below illustrates the clean energy and climate goals entities have set within Dane County.
Also check out the Profiles of Dane County School Districts to learn more about what specific school districts are doing.
| Entity | Total Energy Reduction |
Renewable Electricity |
Renewable Energy |
GHG Emissions |
|---|---|---|---|---|
| Dane County | 100% by 2025 | 25% by 2025 | ||
| Fitchburg | 30% by 2030* 50% by 2050* |
25% by 2025 100% by 2030 |
25% by 2025 |
|
| Madison |
25% by 2025 |
100% by 2030 | ||
| Madison Metropolitan School District |
50% by 2030 75% by 2035 100% by 2040 |
|||
| Marshall | 60% by 2030 80% by 2035 100% by 2040 |
|||
| Middleton | 15% by 2030 50% by 2050 |
25% by 2025 80% by 2030 100% by 2035 |
25% by 2025 66% by 2030 88% by 2035 100% by 2040 |
|
| Middleton School District | 100% by 2035 | |||
| Monona | 15% by 2030 40% by 2040 50% by 2050 |
35% by 2025 100% by 2030 |
25% by 2025 65% by 2030 85% by 2035 100% by 2040 |
|
| Stoughton | 25% by 2025 | |||
| Sun Prairie | 25% by 2025 | |||
| Waunakee | 25% by 2025 |
| Entity | Total Energy Reduction |
Renewable Electricity |
Renewable Energy |
GHG Emissions |
|---|---|---|---|---|
| Dane County | 50% by 2030 100% by 2050 |
|||
| Fitchburg | 30% by 2030* 50% by 2050* |
|||
| Madison | 100% by 2050 | 100% by 2050 | ||
| Marshall | 33% by 2030 66% by 2040 100% by 2050 |
|||
| Middleton | 10% by 2030 40% by 2050 |
20% by 2025 66% by 2030 88% by 2035 100% by 2040 |
21% by 2030 80% by 2040 100% by 2050 |
|
| Monona | 10% by 2030 40% by 2050 |
35% by 2025 66% by 2030 88% by 2035 100% by 2040 |
20% by 2030 80% by 2040 100% by 2050 |
Here are a few resources available to help communities set climate goals:
Once a community has set goals they can track progress against those goals, just as Dane County is tracking progress on its Climate Action Plan.
Climate change exposes some of the systemic inequities in our societies, both locally and globally. Frontline communities that are already struggling to respond to climate change impacts are often communities with lower carbon emissions. Wealthy households tend to have higher emissions than low-income households, while simultaneously possessing the means to escape climate impacts.
In our Climate Action Plan Dane County commits to address equity and social justice because we acknowledge the racism and inequities in the ways we have produced and used fossil fuels historically. We encourage other communities to integrate an equity lens into their climate and clean energy efforts as well.

As you begin to think about how to address equity, check out these resources:
Also, take a look at what other communities around the US are doing on equity. Both Providence, RI and Portland, OR have received recognition for integrating climate justice into their efforts.
Are you ready to inspire businesses and residents to adopt sustainable practices in their own lives? Are you already thinking about how key institutions such as local houses of worship or beloved landmarks can take action that inspires others?
Ultimately, government has a critical role in helping prepare, educate, and inspire citizens to make sustainability the 'new normal,' and to engage citizens in sharing a commitment to reducing energy usage. But influencing long-term change is difficult. By beginning with your internal government operations, you will gain credibility while building a community that is willing and prepared to take action.
And if you take time to understand local emissions and equity concerns you will be better prepared for questions. Learn from existing research about what works--and doesn't--to influence practices. Some important rules of thumb as you think about inspiring change:
As you inspire action be sure to celebrate milestones and share successes widely. As residents and businesses hear about the efforts of their peers that will inspire more action too. Plus talking about your sustainability efforts can help you attract new residents and new businesses to your community. So as you become greener, share the news of your successes widely!
Below are some resources available to help local governments take action on climate change:
Additionally, you might want to learn from what others are doing.
Finally, many national resources are also available: