Maps are a great way to visualize what is happening so check out these map resources.
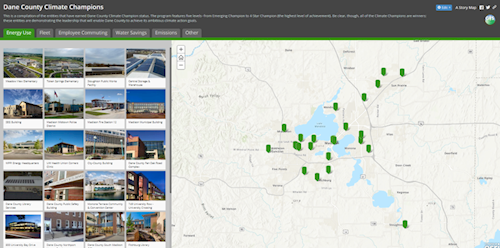
In 2020 we launched a Climate Champion program to recognize entities leading on climate action.
The Climate Champion map features all of the Climate Champions with details about their accomplishments.
Learn more about how you can earn a Climate Champion status.
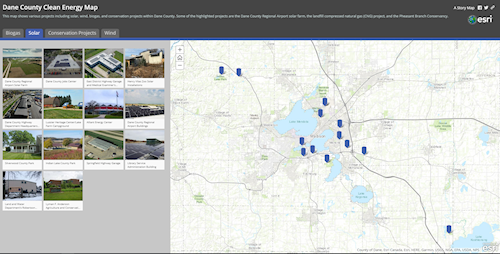
Dane County government, local governments, local businesses and residents have made investments in cost-effective job-creating clean energy and land conservation projects.
You can learn more about these projects in our clean energy map.
The interactive map includes solar, wind, and biogas installations as well as land conservation projects. The various projects identified on the map deliver multiple benefits. These projects:
Perhaps most important, these projects set an example for others by showing what is possible. The solar system on a local school might inspire a private business to explore solar for their own facility, for example. That's the aim here--we want you to see what others are doing so that you are inspired to take action as well. We hope our map will inspire more entities to explore the benefits of clean energy and reduced greenhouse gas emissions.
More clean energy is being installed in Dane County all the time. If you've got a project that is not on the map, be assured we want to add you to the map! Fill out this form to get your project added to the clean energy map. Note that the map includes clean energy installations at local governments, schools, businesses and nonprofits. We do not include residential installations, largely because there are too many to track!
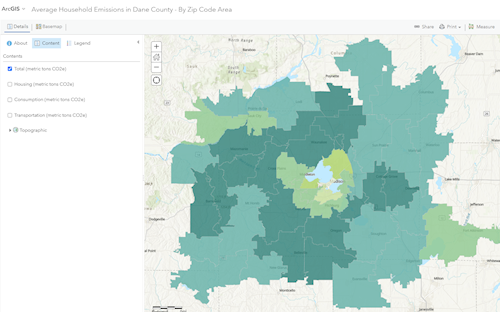
Are you curious about how your carbon emissions compare to other households in Dane County?
Dane County is working with CoolClimate Network, a UC-Berkeley consortium to help Dane County residents understand their carbon emissions.
Check out the CoolClimate map of average annual household carbon emissions to better understand how emissions vary across the county and around the US.
We've created a local Dane County map using the CoolClimate Network data. On our local map you can look at total household emissions and you can also look at the specific emissions associated with housing, with transportation, and with goods and services. Check it out!
The map illustrates how various aspects of emissions--transportation, housing--vary from one area to the next.
As your understanding of emissions increases, you can use our CoolClimate carbon calculator to see how your household compares to others in your zip code. The tool will also help you identify ways you could reduce your carbon emissions.
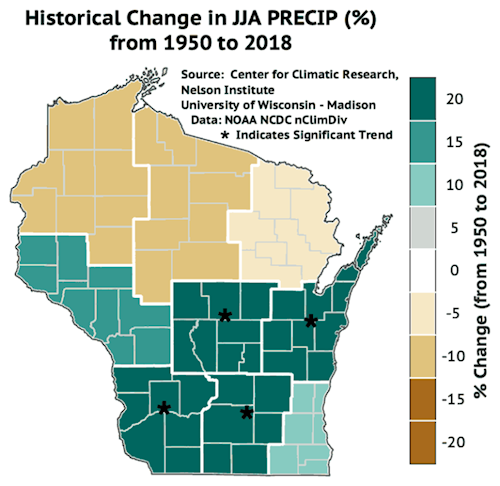
When it comes to understanding climate change, we are lucky to have access to world-class scientists via the Wisconsin Initiative on Climate Change Impacts (WICCI).
WICCI is a partnership between the University of Wisconsin and the Wisconsin Department of Natural Resources.
WICCI's website features numerous maps showing both historical climate trends (how things have already changed) and projections about future changes in our climate. Definitely check it out!
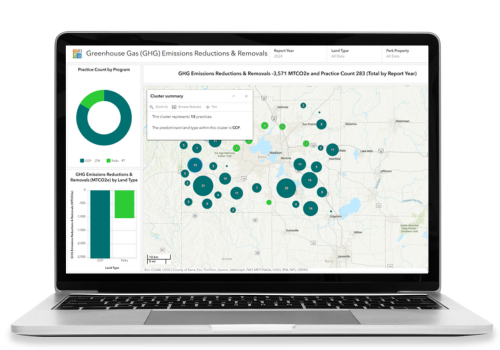
In their efforts to collect more data on carbon emissions, the Land and Water Resources Department created the Greenhouse Gas Dashboard which is an interactive map that you can use to track soil sequestration across Dane County’s restoration and conservation projects
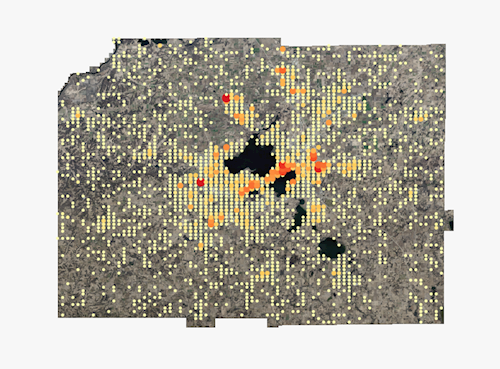
Capital Area Regional Planning Commission (CARPC) staff created this map of rooftop solar installations in Dane County using municipal permit data and aerial imagery. If you zoom out on the map you can see which areas of the County have more total solar and if you zoom in you can see specific solar installations.
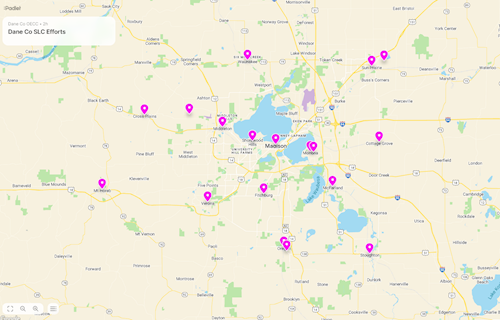
The SLC is the Sustainability Leaders Collaborative. The Sustainability Leaders Collaborative (SLC) is a partnership of the cities, towns, villages, and school districts across Dane County. SLC facilitates collaboration, enabling all Dane County communities to achieve their sustainability goals by sharing resources and working together to reduce emissions and increase resiliency. Explore the map of local government and school district activities around Dane County
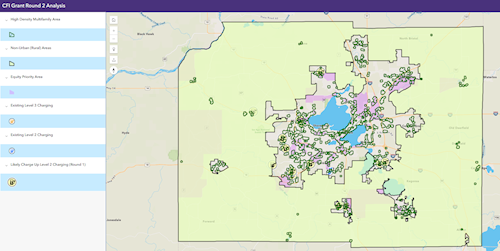
The aim of Charge Up Dane County is to make affordable EV charging available to everyone so we are focused on adding charging near multi-family buildings (where residents lack access to dedicated charging), in rural areas and near multi-modal hubs. The emphasis here is on affordable charging, not high-speed charging. (Other stakeholders are addressing gaps in high speed charging.). The map linked here shows existing charging infrastructure as well as the sites we've already identified for new infrastructure. Also shown are some of our priorities like areas with multifamily housing.
