Dane County was the first county in Wisconsin to develop a Climate Action Plan (CAP). The CAP identified numerous strategies for reducing greenhouse gas emissions and, via world-class climate modeling, showed that if we all worked together,we could cut countywide emissions in half by 2030 and be carbon neutral by 2050.

Different from many CAPs across the world, ours does not list a series of policies to adopt. As a county government in Wisconsin we do not have the authority to mandate action so in creating the CAP local stakeholders focused on the things we can do—collaborative efforts to cut emissions in ways that increase prosperity and reduce environmental impacts. CAP stakeholders also focused on equity, recognizing that the people in our communities who suffer the most from climate impacts are often the ones least responsible for our climate crisis.
Ours is a collaborative approach where diverse stakeholders are working on multiple strategies to reduce a variety of emissions. The best way to assess our progress is to do a periodic emissions inventory to see how our emissions are changing. The insights from the inventory can help us adjust our priorities so that we stay on track to cut emissions in half by 2030 and to be carbon neutral by 2050.


We celebrate local leadership on climate action via the Climate Champions program. This is one example of our collaborative efforts.
As part of the CAP we created a 2017 emissions baseline in conjunction with the team that did climate modeling for us. In the years since 2017, though, as more communities have done emissions inventories, there has been an emphasis on consistency—on everyone using the same tools so that inventories are easy to compare and replicable. We decided to update our 2017 emissions inventory using ICLEI’s ClearPath system so that our inventory was consistent with ones done by other Wisconsin communities. This also made it easier to see how things changed since 2017, because we were comparing similar protocols.
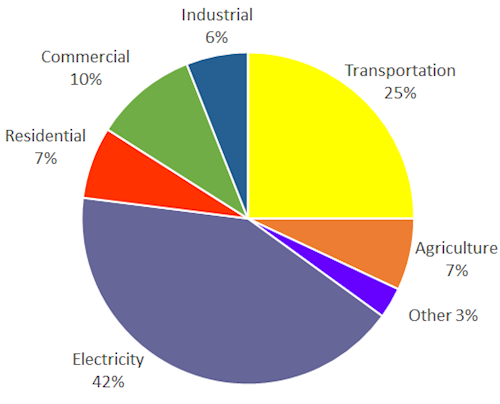
The graph below summarizes our updated 2017 emissions inventory. This is an inventory of the emissions we produce in Dane County, not an inventory of the emissions tied to everything we consume (often called a Consumption Inventory); a consumption inventory would be higher than what it shown here because it would include all of the emissions associated with all of the things we consume on an annual basis (consumer goods, food, building products, etc.).
Our estimated total emissions for 2017 of 9.7 million metric tons of carbon dioxide equivalents (MMTCO2e) are higher than reported in the CAP. This reflects both a change in protocols used to calculate emissions in some cases (e.g., agricultural emissions are now calculated using an EPA methodology consistent with the State of Wisconsin Department of Natural Resources and other counties with agricultural operations like Eau Claire County) and better information than we had previously (which was the case with total electric consumption).

In the CAP we referenced an absolute emission reduction of 50%. That means the 2030 goal, based on the updated inventory, is 4.87 Million Metric Tons of CO2 equivalents.
OECC staff also completed a 2022 inventory of countywide greenhouse gas emissions.
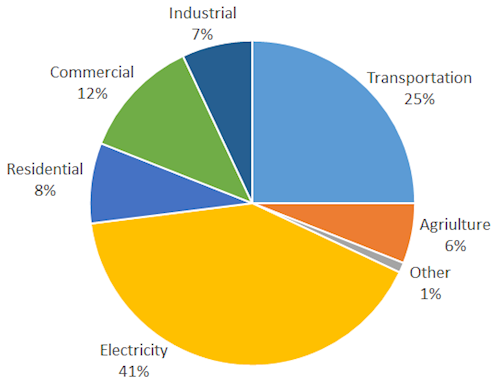
The good news is that our countywide 2022 emissions are lower than the 2017 emissions by 3% even though, during that same time, countywide population grew by 7%. (Sometimes it is helpful to look at emissions per person: here in Dane County our per-person emissions went down by 9% between 2017 and 2022.)
The chart below summarizes 2022 emissions of 9.4 MMTCO2e, which look similar to the 2017 emissions.

The table below summarizes the differences between the 2017 the 2022 inventories. For a more detailed summary of the two inventories, see here.
| Emissions Source (MTCO2e) | 2017 | 2022 | % Change |
|---|---|---|---|
| Electricity | 4,078,053 | 3,849,089 | -6% |
| Nat'l Gas & Other Building Fuels | 2,232,002 | 2,477,313 | 11% |
| Transportation | 2,502,883 | 2,385,415 | -5% |
| Agriculture | 656,236 | 595,096 | -9% |
| Other | 272,484 | 119,424 | -56% |
| Total | 9,741,658 | 9,426,338 | -3% |
| Population | 531,775 | 568,203 | 7% |
| Emissions per person (MTCO2e) | 18.32 | 16.59 | -9% |
The three biggest sources of emissions in Dane County are:
In this section we discuss progress addressing each of these categories of emissions.
Between 2017 and 2022 the amount of electricity used in Dane County increased from 5,353 GWh to 5,600 G Wh, an increase of 5%. Yet electric emissions are down 6%, largely because our electric grid is getting cleaner as utilities close coal power plants and everyone transitions to more renewable electricity. It is also notable that electric consumption did not rise as much as our population, which is a sign that we’re becoming a little more energy efficient.
To be on track for our 2030 goals we need our electric grid to be substantially cleaner by 2030. Per EPA data, Dane County’s electric grid is about 13% cleaner in 2022 compared to 2016. Local utilities including Alliant Energy & Madison Gas & Electric have substantive 2030 goals, suggesting they are aiming to make the grid at least 50% cleaner by 2030, which would be on track with our CAP goals. You can learn more about current emissions from electricity on our grid from the EPA EGrid website (we are in the MROE region).
Transportation emissions include the cars, trucks and SUVs we drive in Dane County but also heavy-duty vehicles, air travel and transit buses.
Between 2017 and 2022 transportati on emissions went down 5% while population went up 7%. This was the most encouraging finding in our inventory—because it suggests that at least some of the reduction in transportation emissions during the pandemic might be permanent, perhaps ti
On transportation we need to continue to transition away from fossil fuel vehicles to electric (and other clean fuel) vehicles and we also need to reduce vehicle miles traveled (VMTs). Data from other cities suggest that the launch of the City of Madison’s Bus Rapid Transit will reduce local VMTs because it will make transit more appealing. We are also encouraged by the addition of a second Amtrak line in Wisconsin and the fact that Dane County continues to see rapid growth in EV adoption.
The bulk of emissions associated with heating our buildings comes from natural gas usage but this category includes other fuels such as fuel oil and propane.
Total emissions in this category went up between 2017 and 2022 by 11% and much of that increase is associated with natural gas and propane usage. Natural gas usage was up 16% and propane up 22% during this timeframe. That is more than the growth in population and more than is easily explained by weather variations. Of the three primary sources of emissions in Dane County, this is the only category where emissions are still rising.
We suspect these increases are tied to population growth, especially since the growth in building fuels is in the residential and commercial sectors, as illustrated in the chart below.
Change in Non-Electric Building Emissions by Sector
| 2017 | 2022 | % Change | |
|---|---|---|---|
| Residential | 664,279 | 785,178 | 18% |
| Commercial | 973,446 | 1,097,268 | 13% |
| Industrial | 594,277 | 594,867 | 0% |
This growth in fossil fuel usage is concerning. It suggests that we need to increase our efforts to accelerate building electrification for both existing and new construction.
We used ICLEI’s ClearPath tool to model countywide 2030 emissions. In this process we assumed existing trends (like Madison’s Building Energy Savings Program and the ongoing growth in electric vehicle adoption) would continue through 2030. We did not assume new efforts so this modeling is relatively conservative.
The good news is that we are already on pace to achieve 80% of our 2030 goals. Details about the modeling findings are summarized here. The graphic below illustrates how the emissions reductions from these current activities increase over time, achieving 80% of our 2030 goal.
The challenge, of course is that we—all of the stakeholders in Dane County—need to commit to additional actions and strategies that further reduce emissions so that we can achieve our 2030 goals.
In October 2024 OECC convened a stakeholder meeting to discuss the results of our modeling and the need for more action. We emphasized that OECC cannot address this gap on our own and that any increase in action across Dane County will require participation from local governments, businesses, nonprofits and residents. These are shared goals and we can only achieve them together. 
At the meeting participants brainstormed strategies associated with key challenges around our emissions associated with buildings, transportation and the energy grid. The meeting helped us identify both challenges and opportunities.
One challenge we identified is that stakeholders have trouble staying aware of everything going on in our communities. For example, in some cases event participants identified what they thought was an innovation only to discover that another group had already implemented that idea. So one outcome is the recongition that we need a better way to track existing efforts to help connect people and ideas.
That realization prompted us to create an interactive resource that will help stakeholders connect to and build upon existing efforts. We hope you will help us keeping this list current; please use this form if you have items you want to add or edit on this summary.
Reaching our shared goals will require multiple stakeholders taking on new efforts, like improving the efficiency of their business, transitioning away from gas cards, and encouraging more efficient new construction. OECC cannot mandate any of the actions required to hit our shared goals; we can convene and lead by example in County operations and provide support but we must also rely on our partners to join us in taking action.
In the coming months we will continue to convene stakeholders to identify and implement strategies to accelerate climate action. If you want to be added to the convening notification list please email OECC@danecounty.gov.